Applications are the files for which applicants have decided to request a European patent from the EPO. They are a direct measure of the explicit interest of innovating firms to assert their patent rights on the European technology market. Patent applications at the EPO grew in 2015, to reach 160 000. This was an increase of 4,8 % over 2014, and the highest ever number. The total applications included close to 98 300 international Patent Cooperation Treaty (PCT) filings which entered the European regional phase (becoming European applications) in 2015, and some 61 700 European patent applications filed directly at the EPO under the European Patent Convention (EPC).


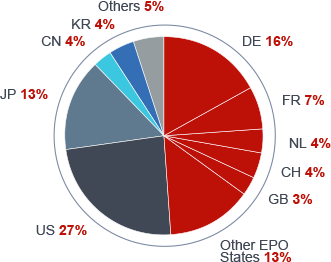
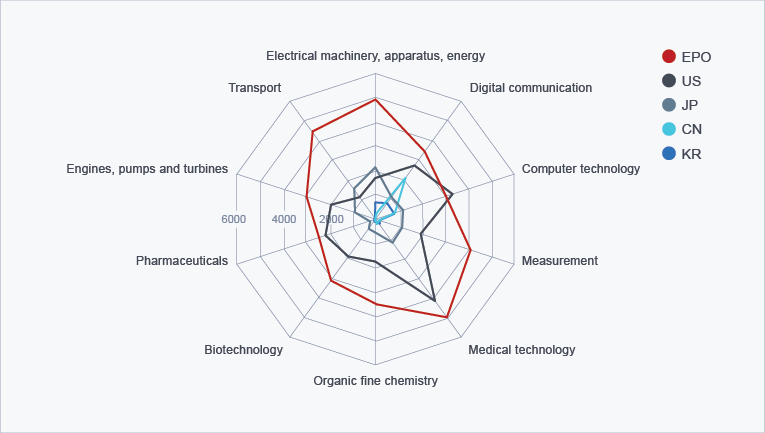
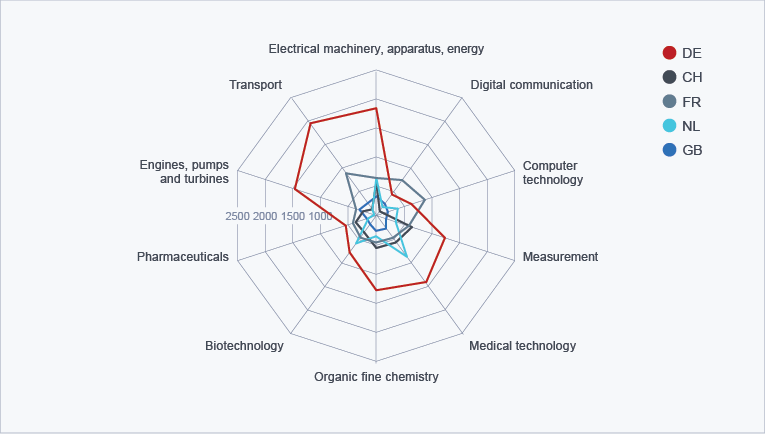
Almost half of all European patent applications came from the EPO member states, followed by the US, Japan, South Korea and China. Applications from Europe grew modestly overall, with marked differences among the larger economies. The most significant growth came from Italy, the UK, Spain, the Netherlands and Switzerland. France grew moderately, while Germany and some of the Nordic countries filed fewer applications. The US and China were the main drivers of growth for applications. Growth from South Korea was moderate and Japanese companies filed fewer applications.
 Analysis based on European patent applications filed with the EPO (Direct European applications and International (PCT) applications
entering the European phase)
Analysis based on European patent applications filed with the EPO (Direct European applications and International (PCT) applications
entering the European phase)| Country | 2015 | 2014 | Change |
|---|---|---|---|
| Albania | 0 | 3 | -100% |
| Austria | 1 992 | 1 964 | 1.4% |
| Belgium | 2 041 | 1 927 | 5.9% |
| Bulgaria | 33 | 34 | -2.9% |
| Switzerland | 7 088 | 6 910 | 2.6% |
| Cyprus | 37 | 44 | -15.9% |
| Czech Republic | 213 | 167 | 27.5% |
| Germany | 24 820 | 25 633 | -3.2% |
| Denmark | 1 930 | 1 983 | -2.7% |
| Estonia | 32 | 38 | -15.8% |
| Spain | 1 527 | 1 471 | 3.8% |
| Finland | 2 000 | 2 182 | -8.3% |
| France | 10 781 | 10 614 | 1.6% |
| United Kingdom | 5 037 | 4 764 | 5.7% |
| Greece | 86 | 95 | -9.5% |
| Croatia | 9 | 12 | -25% |
| Hungary | 99 | 114 | -13.2% |
| Ireland | 582 | 622 | -6.4% |
| Iceland | 45 | 42 | 7.1% |
| Italy | 3 979 | 3 649 | 9% |
| Liechtenstein | 371 | 278 | 33.5% |
| Lithuania | 39 | 24 | 62.5% |
| Luxembourg | 404 | 454 | -11% |
| Latvia | 29 | 8 | 262.5% |
| Monaco | 29 | 21 | 38.1% |
| Macedonia, Former Yugoslav Republic of | 0 | 1 | -100% |
| Malta | 85 | 62 | 37.1% |
| Netherlands | 7 100 | 6 874 | 3.3% |
| Norway | 512 | 529 | -3.2% |
| Poland | 568 | 482 | 17.8% |
| Portugal | 137 | 113 | 21.2% |
| Romania | 33 | 28 | 17.9% |
| Serbia | 4 | 11 | -63.6% |
| Sweden | 3 839 | 3 873 | -0.9% |
| Slovenia | 118 | 125 | -5.6% |
| Slovakia | 48 | 26 | 84.6% |
| San Marino | 3 | 5 | -40% |
| Turkey | 447 | 403 | 10.9% |
| Andorra | 2 | 2 | 0% |
| United Arab Emirates | 27 | 27 | 0% |
| Anguilla | 1 | 2 | -50% |
| Armenia | 2 | 2 | 0% |
| Argentina | 24 | 15 | 60% |
| Australia | 819 | 788 | 3.9% |
| Azerbaijan | 2 | 0 | |
| Barbados | 66 | 114 | -42.1% |
| Bangladesh | 7 | 1 | 600% |
| Bahrain | 1 | 2 | -50% |
| Bermuda | 77 | 71 | 8.5% |
| Brunei Darussalam | 0 | 1 | -100% |
| Brazil | 187 | 208 | -10.1% |
| Bahamas | 10 | 7 | 42.9% |
| Belarus | 5 | 3 | 66.7% |
| Belize | 2 | 3 | -33.3% |
| Canada | 1 645 | 1 708 | -3.7% |
| Cook Islands | 2 | 0 | |
| Chile | 29 | 42 | -31% |
| China, People’s Republic of | 5 721 | 4 680 | 22.2% |
| Colombia | 26 | 13 | 100% |
| Costa Rica | 4 | 0 | |
| Cuba | 7 | 8 | -12.5% |
| Curaçao | 10 | 14 | -28.6% |
| Algeria | 2 | 2 | 0% |
| Ecuador | 0 | 4 | -100% |
| Egypt | 5 | 6 | -16.7% |
| Faroe Islands | 1 | 3 | -66.7% |
| Georgia | 1 | 0 | |
| Guernsey | 1 | 0 | |
| Gibraltar | 12 | 10 | 20% |
| Hong Kong | 74 | 26 | 184.6% |
| Indonesia | 11 | 2 | 450% |
| Israel | 1 100 | 1 048 | 5% |
| Isle of Man | 1 | 0 | |
| India | 574 | 541 | 6.1% |
| Iran, Islamic Republic of | 3 | 3 | 0% |
| Jamaica | 1 | 0 | |
| Jordan | 3 | 3 | 0% |
| Japan | 21 426 | 22 118 | -3.1% |
| Kenya | 1 | 1 | 0% |
| Kyrgyzstan | 0 | 1 | -100% |
| Saint Kitts and Nevis | 3 | 0 | |
| Korea, Democratic People's Republic of | 1 | 1 | 0% |
| Korea, Republic of | 6 411 | 6 166 | 4% |
| Kuwait | 2 | 7 | -71.4% |
| Cayman Islands | 119 | 150 | -20.7% |
| Kazakhstan | 8 | 2 | 300% |
| Lebanon | 3 | 3 | 0% |
| Saint Lucia | 1 | 0 | |
| Sri Lanka | 3 | 0 | |
| Morocco | 5 | 2 | 150% |
| Moldova, Republic of | 1 | 2 | -50% |
| Marshall Islands | 1 | 2 | -50% |
| Mongolia | 1 | 0 | |
| Macao | 6 | 4 | 50% |
| Mauritius | 9 | 4 | 125% |
| Mexico | 68 | 55 | 23.6% |
| Malaysia | 56 | 53 | 5.7% |
| New Zealand | 188 | 180 | 4.4% |
| Oman | 3 | 0 | |
| Panama | 5 | 9 | -44.4% |
| Peru | 1 | 2 | -50% |
| Papua New Guinea | 1 | 0 | |
| Philippines | 14 | 14 | 0% |
| Pakistan | 0 | 4 | -100% |
| Puerto Rico | 24 | 13 | 84.6% |
| Palestine, State of | 0 | 2 | -100% |
| Qatar | 24 | 24 | 0% |
| Russian Federation | 230 | 209 | 10% |
| Saudi Arabia | 182 | 290 | -37.2% |
| Seychelles | 3 | 4 | -25% |
| Singapore | 391 | 364 | 7.4% |
| Senegal | 0 | 1 | -100% |
| Syrian Arab Republic | 1 | 0 | |
| Turks and Caicos Islands | 0 | 1 | -100% |
| Thailand | 23 | 19 | 21.1% |
| Tunisia | 4 | 2 | 100% |
| Trinidad and Tobago | 0 | 1 | -100% |
| Chinese Taipei | 1 260 | 1 119 | 12.6% |
| Ukraine | 19 | 14 | 35.7% |
| United States | 42 692 | 36 668 | 16.4% |
| Uruguay | 9 | 4 | 125% |
| Uzbekistan | 1 | 1 | 0% |
| Saint Vincent and the Grenadines | 0 | 2 | -100% |
| Venezuela | 4 | 1 | 300% |
| Virgin Islands, British | 111 | 111 | 0% |
| Virgin Islands, U.S. | 2 | 2 | 0% |
| Viet Nam | 5 | 4 | 25% |
| Samoa | 3 | 0 | |
| South Africa | 98 | 112 | -12.5% |
| Not classified | 37 | 11 | 236.4% |
| Austria | 1 992 | 1 964 | 1.4% |
| Belgium | 2 041 | 1 927 | 5.9% |
| Bulgaria | 33 | 34 | -2.9% |
| Cyprus | 37 | 44 | -15.9% |
| Czech Republic | 213 | 167 | 27.5% |
| Germany | 24 820 | 25 633 | -3.2% |
| Denmark | 1 930 | 1 983 | -2.7% |
| Estonia | 32 | 38 | -15.8% |
| Spain | 1 527 | 1 471 | 3.8% |
| Finland | 2 000 | 2 182 | -8.3% |
| France | 10 781 | 10 614 | 1.6% |
| United Kingdom | 5 037 | 4 764 | 5.7% |
| Greece | 86 | 95 | -9.5% |
| Croatia | 9 | 12 | -25% |
| Hungary | 99 | 114 | -13.2% |
| Ireland | 582 | 622 | -6.4% |
| Italy | 3 979 | 3 649 | 9% |
| Lithuania | 39 | 24 | 62.5% |
| Luxembourg | 404 | 454 | -11% |
| Latvia | 29 | 8 | 262.5% |
| Malta | 85 | 62 | 37.1% |
| Netherlands | 7 100 | 6 874 | 3.3% |
| Poland | 568 | 482 | 17.8% |
| Portugal | 137 | 113 | 21.2% |
| Romania | 33 | 28 | 17.9% |
| Sweden | 3 839 | 3 873 | -0.9% |
| Slovenia | 118 | 125 | -5.6% |
| Slovakia | 48 | 26 | 84.6% |
Medical technology was still the field where the most applications were filed and was also one of the fastest growing areas. Other fields with strong growth were Engines, pumps and turbines, Pharmaceuticals, Measurement and Computer technology. Only Transport and Electrical machinery and energy showed a slowdown in the number of applications.
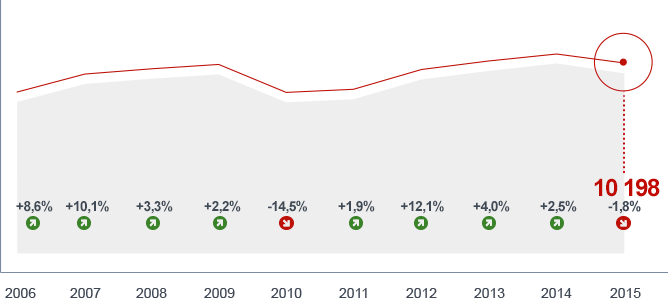
This field encompasses lighting devices, power and electric energy supply systems, basic electric elements and techniques. Some specific examples of technologies in this field are power cables, magnets, relays and x-rays techniques.
| 2015 | ||
|---|---|---|
| 1. | PHILIPS | 483 |
| 2. | SIEMENS | 429 |
| 3. | ABB | 293 |
| 4. | LG | 238 |
| 5. | GENERAL ELECTRIC | 220 |
| 6. | SAMSUNG | 196 |
| 7. | ROBERT BOSCH | 188 |
| 8. | PANASONIC | 171 |
| 9. | TE CONNECTIVITY | 150 |
| 10. | VALEO | 123 |
| Others | 7 707 | |
| Total applications in this field | 10 198 | |

|
|
2015 | vs. 2014 |
|---|---|---|
| Germany | 1 838 | -11.4% |
| France | 627 | -3.8% |
| Switzerland | 533 | +3.3% |
| Netherlands | 627 | +0.2% |
| United Kingdom | 271 | -19.6% |
| other EPO member states | 1 008 | +6.7% |
| United States | 1 791 | +9.3% |
| Japan | 2 180 | -0.8% |
| China, People’s Republic of | 290 | +16.0% |
| Korea, Republic of | 670 | -15.5% |
| Others | 363 | 0.0% |
| Total applications in this field | 10 198 | |
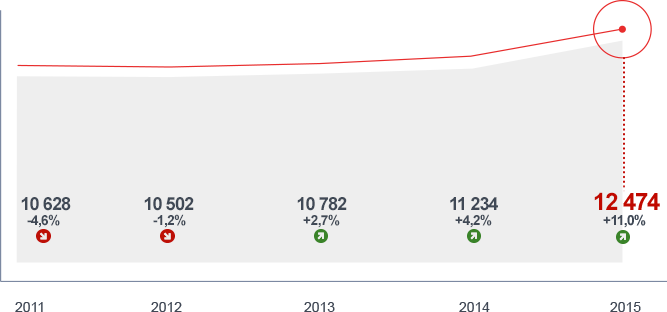
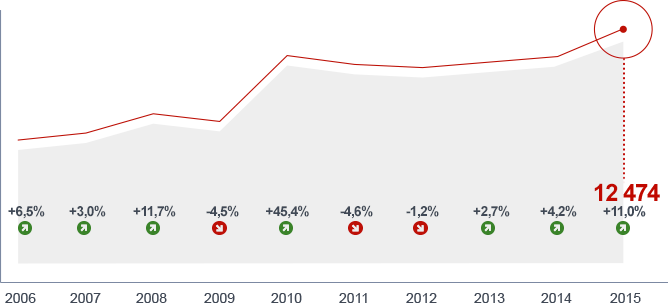
The field of Medical technology covers medical instruments for diagnosis, treatment of diseases and surgery. Technologies included in this field are, for example, vaccination instruments, prostheses, surgical robots, computed tomography and pacemakers.
| 2015 | ||
|---|---|---|
| 1. | PHILIPS | 712 |
| 2. | JOHNSON & JOHNSON | 497 |
| 3. | MEDTRONIC | 411 |
| 4. | OLYMPUS | 317 |
| 5. | SANOFI | 279 |
| 6. | BOSTON SCIENTIFIC | 260 |
| 7. | PROCTER & GAMBLE | 121 |
| 8. | ABBOTT | 118 |
| 9. | SAMSUNG | 116 |
| 10. | FRESENIUS | 112 |
| Others | 9 531 | |
| Total applications in this field | 12 474 | |

|
|
2015 | vs. 2014 |
|---|---|---|
| Germany | 1 456 | +7.8% |
| France | 493 | +5.3% |
| Switzerland | 539 | +22.2% |
| Netherlands | 792 | +8.9% |
| United Kingdom | 278 | 0.0% |
| other EPO member states | 1 419 | +9.8% |
| United States | 5 158 | +17.1% |
| Japan | 1 152 | -2.5% |
| China, People's Republic of | 133 | +17.7% |
| Korea, Republic of | 215 | -3.6% |
| Others | 839 | +11.7% |
| Total applications in this field | 12 474 | |
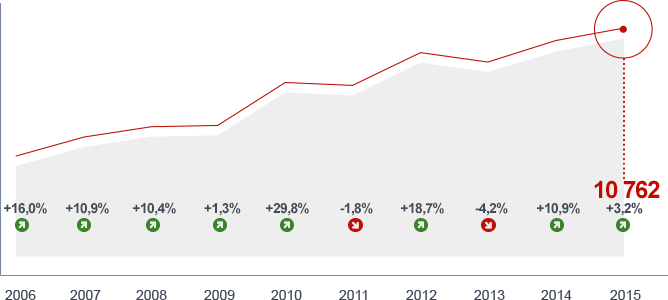
This field encompasses basic electronic circuitry and electronic communication. The field includes, for example, amplifiers, decoders and telegraphic communication.
| 2015 | ||
|---|---|---|
| 1. | HUAWEI | 1197 |
| 2. | ERICSSON | 959 |
| 3. | QUALCOMM | 744 |
| 4. | ZTE | 546 |
| 5. | SAMSUNG | 409 |
| 6. | NOKIA | 362 |
| 7. | INTEL | 329 |
| 8. | LG | 294 |
| 9. | SONY | 292 |
| 10. | ALCATEL LUCENT | 283 |
| Others | 5 347 | |
| Total applications in this field | 10 762 | |

|
|
2015 | vs. 2014 |
|---|---|---|
| Germany | 468 | +0.2% |
| France | 732 | -27.6% |
| Switzerland | 91 | +2.2% |
| Netherlands | 208 | -8.4% |
| United Kingdom | 246 | +1.7% |
| other EPO member states | 1 640 | -8.5% |
| United States | 2 837 | +3.3% |
| Japan | 1 152 | +5.8% |
| China, People’s Republic of | 2 069 | +42.8% |
| Korea, Republic of | 790 | -2.3% |
| Others | 529 | +5.8% |
| Total applications in this field | 10 762 | |
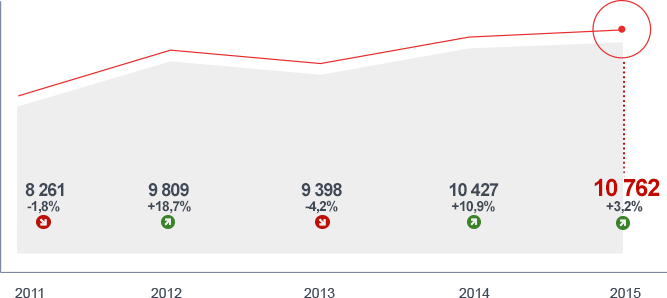
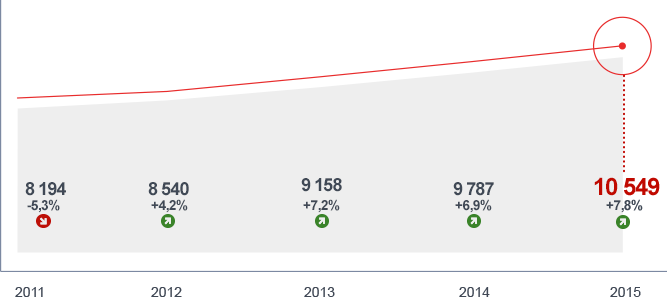
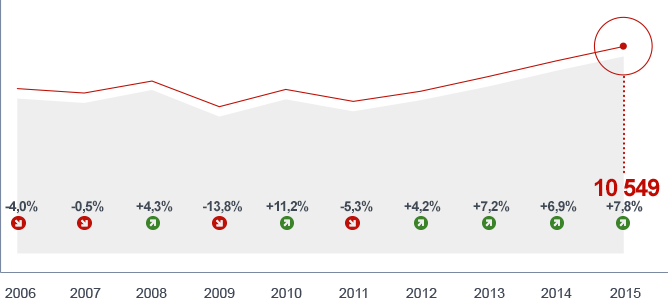
This field encompasses computing, calculating and counting devices. It includes, for example, digital computers and data processing systems.
| 2015 | ||
|---|---|---|
| 1. | MICROSOFT | 560 |
| 2. | SAMSUNG | 460 |
| 3. | QUALCOMM | 321 |
| 4. | INTEL | 312 |
| 5. | 309 | |
| 6. | TECHNICOLOR | 270 |
| 7. | HUAWEI | 263 |
| 8. | HEWLETT-PACKARD | 262 |
| 9. | PHILIPS | 233 |
| 10. | NOKIA | 176 |
| Others | 7 383 | |
| Total applications in this field | 10 549 | |

|
|
2015 | vs. 2014 |
|---|---|---|
| Germany | 680 | -1.6% |
| France | 828 | +6.4% |
| Switzerland | 144 | +23.1% |
| Netherlands | 392 | +4.5% |
| United Kingdom | 272 | +37.4% |
| other EPO member states | 756 | -3.9% |
| United States | 4 372 | +22.5% |
| Japan | 1 152 | -17.9% |
| China, People’s Republic of | 705 | +37.7% |
| Korea, Republic of | 722 | -10.1% |
| Others | 526 | -4.9% |
| Total applications in this field | 10 549 | |
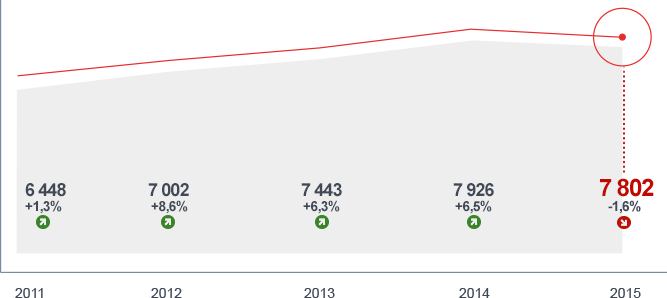
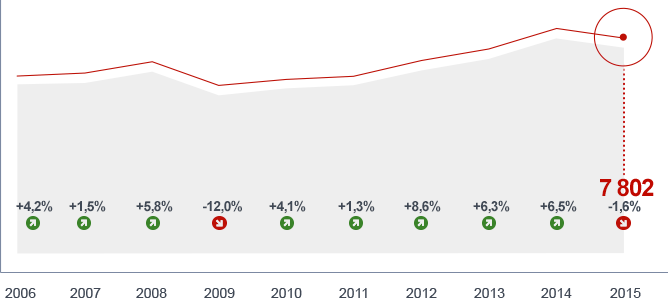
This field encompasses vehicles, and more specifically vehicle tyres, wheels, windows and roofs, railway systems.
| 2015 | ||
|---|---|---|
| 1. | TOYOTA MOTOR | 275 |
| 2. | AIRBUS | 258 |
| 3. | SIEMENS | 176 |
| 4. | ROBERT BOSCH | 175 |
| 5. | CONTINENTAL | 154 |
| 5. | VALEO | 154 |
| 7. | UNITED TECHNOLOGIES | 149 |
| 8. | PSA PEUGEOT | 130 |
| 9. | RENAULT | 128 |
| 10. | AUDI | 124 |
| Others | 6 079 | |
| Total applications in this field | 7 802 | |

|
|
2015 | vs. 2014 |
|---|---|---|
| Germany | 1 930 | -4.3% |
| France | 911 | +1.9% |
| Switzerland | 121 | -7.6% |
| Netherlands | 143 | +16.3% |
| United Kingdom | 350 | +34.6% |
| other EPO member states | 1 107 | +6.6% |
| United States | 1 219 | +11.7% |
| Japan | 1 523 | -18.8% |
| China, People’s Republic of | 92 | -25.2% |
| Korea, Republic of | 150 | +7.9% |
| Others | 256 | +14.8% |
| Total applications in this field | 7 802 | |
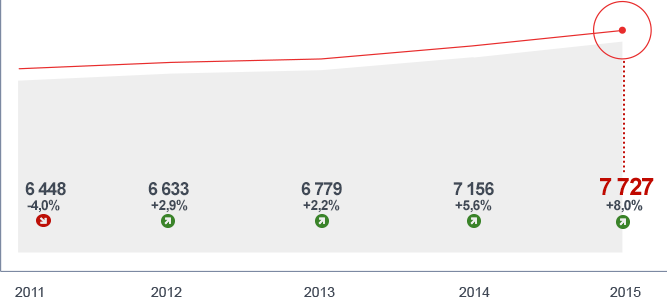
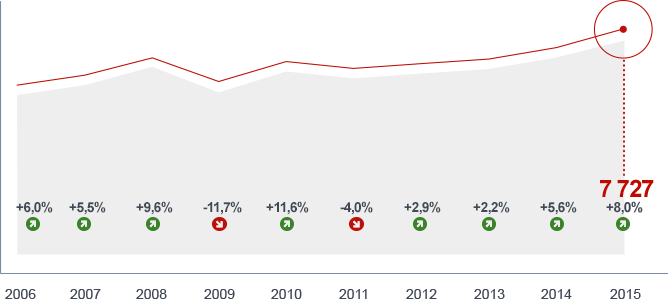
This field encompasses horology, devices for measuring position and displacement, more specifically clocks and watches, navigation systems, volume, liquid and sound measuring devices.
| 2015 | ||
|---|---|---|
| 1. | PHILIPS | 195 |
| 2. | ROBERT BOSCH | 132 |
| 3. | SIEMENS | 126 |
| 4. | GENERAL ELECTRIC | 104 |
| 5. | CEA 1) | 97 |
| 6. | HALLIBURTON | 94 |
| 6. | HITACHI | 94 |
| 8. | HONEYWELL | 81 |
| 9. | HOFFMANN-LA ROCHE | 77 |
| 9. | QUALCOMM | 77 |
| Others | 6 650 | |
| Total applications in this field | 7 727 | |

|
|
2015 | vs. 2014 |
|---|---|---|
| Germany | 1 342 | +1.2% |
| France | 590 | +4.4% |
| Switzerland | 677 | +0.1% |
| Netherlands | 383 | +12.3% |
| United Kingdom | 289 | -5.6% |
| other EPO member states | 851 | +13.2% |
| United States | 1 933 | +21.0% |
| Japan | 1 046 | +0.6% |
| China, People's Republic of | 160 | +19.4% |
| Korea, Republic of | 138 | +3.0% |
| Others | 322 | +12.6% |
| Total applications in this field | 7 727 | |
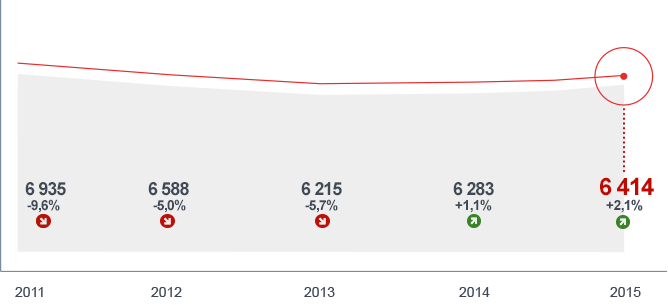
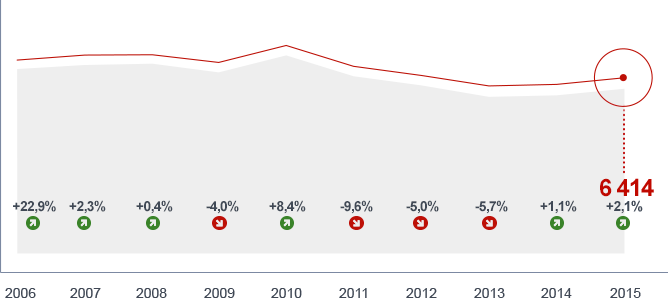
This field encompasses organic pure substances, combinatorial chemistry, and preparations for medical, dental and hygiene uses. It includes, for example, steroids, sugars, cosmetics, pharmaceuticals and food ingredients.
| 2015 | ||
|---|---|---|
| 1. | BAYER | 286 |
| 2. | BASF | 264 |
| 3. | HOFFMANN-LA ROCHE | 175 |
| 4. | L'OREAL | 160 |
| 5. | EVONIK | 142 |
| 6. | UNILEVER | 137 |
| 7. | JOHNSON & JOHNSON | 124 |
| 8. | PROCTER & GAMBLE | 118 |
| 9. | NOVARTIS | 109 |
| 10. | BRISTOL-MYERS SQUIBB | 103 |
| Others | 4 796 | |
| Total applications in this field | 6 414 | |

|
|
2015 | vs. 2014 |
|---|---|---|
| Germany | 1 283 | -12.1% |
| France | 489 | +12.9% |
| Switzerland | 568 | +2.3% |
| Netherlands | 291 | +21.8% |
| United Kingdom | 270 | +0.7% |
| other EPO member states | 630 | +7.7% |
| United States | 1 746 | +12.5% |
| Japan | 540 | -6.9% |
| China, People's Republic of | 149 | -13.9% |
| Korea, Republic of | 122 | +24.5% |
| Others | 326 | -3.6% |
| Total applications in this field | 6 414 | |
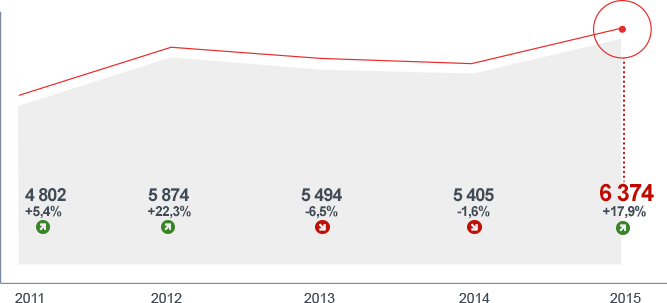
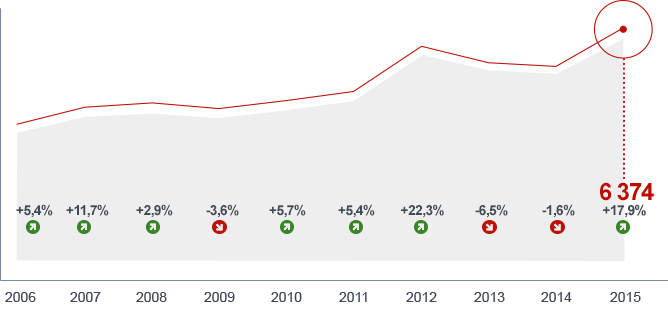
This field encompasses combustion engines, engines and pumps for liquids, eolic energy, nuclear physics and engineering. It covers, for example, gas-turbine plants, pumps and pistons, fusion and nuclear reactors, x-ray microscopes and wind motors.
| 2015 | ||
|---|---|---|
| 1. | UNITED TECHNOLOGIES | 1 080 |
| 2. | GENERAL ELECTRIC | 432 |
| 3. | ROLLS-ROYCE | 336 |
| 4. | SIEMENS | 325 |
| 5. | ROBERT BOSCH | 182 |
| 6. | MITSUBISHI HEAVY INDUSTRIES | 151 |
| 7. | TOYOTA MOTOR | 149 |
| 8. | SAFRAN | 119 |
| 9. | CONTINENTAL | 71 |
| 10. | PFEIFFER VACUUM | 70 |
| Others | 3 459 | |
| Total applications in this field | 6 374 | |

|
|
2015 | vs. 2014 |
|---|---|---|
| Germany | 1 467 | -0.7% |
| France | 331 | -10.3% |
| Switzerland | 241 | -9.7% |
| Netherlands | 59 | +18.0% |
| United Kingdom | 280 | +21.7% |
| other EPO member states | 686 | +1.2% |
| United States | 2 096 | +100.8% |
| Japan | 910 | -3.8% |
| China, People’s Republic of | 32 | -36.0% |
| Korea, Republic of | 86 | -17.3% |
| Others | 186 | -2.1% |
| Total applications in this field | 6 374 | |
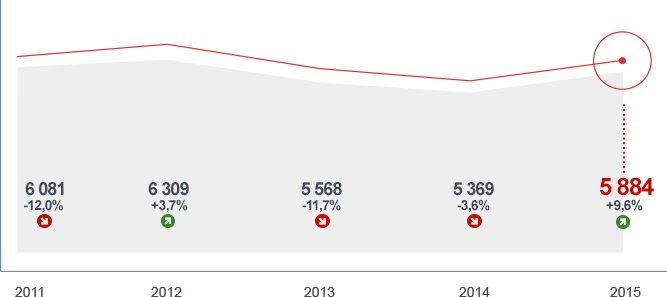
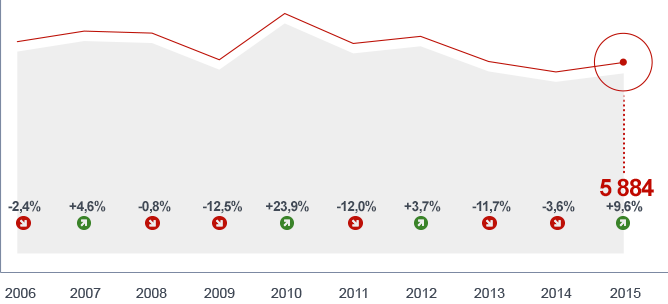
This field encompasses preparations for medical, dental or hygiene purposes, for example emulsions, dragees and amalgams.
| 2015 | ||
|---|---|---|
| 1. | MERCK & CO | 118 |
| 2. | NOVARTIS | 116 |
| 3. | INSERM 1) | 87 |
| 4. | HOFFMANN-LA ROCHE | 65 |
| 5. | BAYER | 64 |
| 5. | SANOFI | 64 |
| 7. | GLAXO SMITH KLINE | 52 |
| 8. | JOHNSON & JOHNSON | 46 |
| 9. | BOEHRINGER INGELHEIM | 44 |
| 10. | CELGENE | 39 |
| Others | 5 189 | |
| Total applications in this field | 5 884 | |

|
|
2015 | vs. 2014 |
|---|---|---|
| Germany | 514 | -7.4% |
| France | 435 | +24.3% |
| Switzerland | 382 | -2.3% |
| Netherlands | 146 | 0.0% |
| United Kingdom | 188 | +1.6% |
| other EPO member states | 913 | +5.5% |
| United States | 2 269 | +25.0% |
| Japan | 296 | -4.2% |
| China, People’s Republic of | 93 | -21.8% |
| Korea, Republic of | 128 | -3.0% |
| Others | 520 | +3.4% |
| Total applications in this field | 5 884 | |
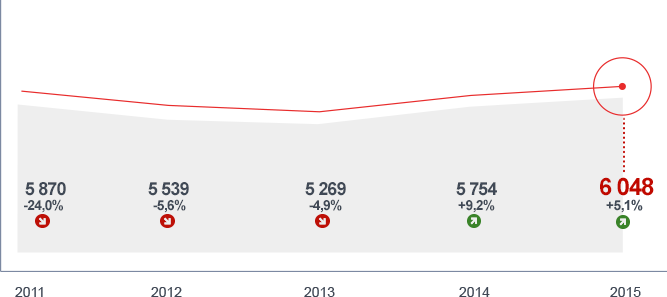
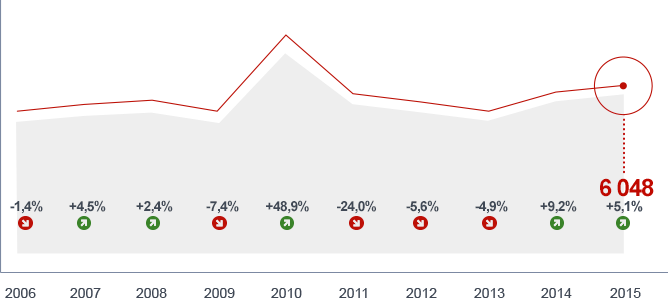
This field encompasses peptides, microbiology and genetic engineering. Included in the field are, for example, genetically modified organisms, brewing of beers, preparation of wine and vinegar.
| 2015 | ||
|---|---|---|
| 1. | DSM | 456 |
| 2. | HOFFMANN-LA ROCHE | 177 |
| 3. | NOVOZYMES | 107 |
| 4. | INSERM 1) | 104 |
| 5. | DU PONT | 80 |
| 6. | BAYER | 61 |
| 7. | BASF | 55 |
| 7. | SANOFI | 55 |
| 9. | NOVARTIS | 44 |
| 10. | QIAGEN | 42 |
| Others | 4 867 | |
| Total applications in this field | 6 048 | |

|
|
2015 | vs. 2014 |
|---|---|---|
| Germany | 669 | -2.0% |
| France | 453 | -5.6% |
| Switzerland | 380 | +0.8% |
| Netherlands | 627 | -16.6% |
| United Kingdom | 176 | -7.9% |
| other EPO member states | 801 | -1.5% |
| United States | 1 915 | +18.9% |
| Japan | 454 | +24.0% |
| China, People’s Republic of | 89 | +56.1% |
| Korea, Republic of | 115 | +4.5% |
| Others | 369 | +19.4% |
| Total applications in this field | 6 048 | |
| Technical Field | 2015 | 2014 | Change |
|
|
|---|---|---|---|---|---|
| Electrical engineering | Electrical machinery, apparatus, energy | 10 198 | 10 387 | -1.8% | |
| Audio-visual technology | 4 250 | 3 876 | 9.6% | ||
| Telecommunications | 3 892 | 3 528 | 10.3% | ||
| Digital communication | 10 762 | 10 427 | 3.2% | ||
| Basic communication processes | 983 | 980 | 0.3% | ||
| Computer technology | 10 549 | 9 787 | 7.8% | ||
| IT methods for management | 1 922 | 2 059 | -6.7% | ||
| Semiconductors | 2 878 | 2 996 | -3.9% | ||
| Instruments | Optics | 3 469 | 3 513 | -1.3% | |
| Measurement | 7 727 | 7 156 | 8% | ||
| Analysis of biological materials | 1 339 | 1 235 | 8.4% | ||
| Control | 2 455 | 2 267 | 8.3% | ||
| Medical technology | 12 474 | 11 234 | 11% | ||
| Chemistry | Organic fine chemistry | 6 414 | 6 283 | 2.1% | |
| Biotechnology | 6 048 | 5 754 | 5.1% | ||
| Pharmaceuticals | 5 884 | 5 369 | 9.6% | ||
| Macromolecular chemistry, polymers | 3 553 | 3 672 | -3.2% | ||
| Food chemistry | 1 661 | 1 644 | 1% | ||
| Basic materials chemistry | 4 885 | 4 347 | 12.4% | ||
| Materials, metallurgy | 3 149 | 3 112 | 1.2% | ||
| Surface technology, coating | 2 334 | 2 322 | 0.5% | ||
| Micro-structural and nanotechnology | 145 | 267 | -45.7% | ||
| Chemical engineering | 3 545 | 3 670 | -3.4% | ||
| Environmental technology | 1 954 | 2 014 | -3% | ||
| Mechanical engineering | Handling | 4 143 | 3 782 | 9.5% | |
| Machine tools | 3 478 | 3 356 | 3.6% | ||
| Engines, pumps, turbines | 6 374 | 5 405 | 17.9% | ||
| Textile and paper machines | 2 304 | 2 252 | 2.3% | ||
| Other special machines | 5 033 | 4 732 | 6.4% | ||
| Thermal processes and apparatus | 2 581 | 2 499 | 3.3% | ||
| Mechanical elements | 4 301 | 3 878 | 10.9% | ||
| Transport | 7 802 | 7 926 | -1.6% | ||
| Other fields | Furniture, games | 2 951 | 2 748 | 7.4% | |
| Other consumer goods | 3 347 | 3 220 | 3.9% | ||
| Civil engineering | 4 886 | 4 667 | 4.7% | ||
| Not classified | 352 | 339 | 3.8% | ||
| Total | 160 022 | 152 703 | |||
European companies filed the most applications in eight of the ten most active fields of technology, with US companies leading in the remaining two, Medical technology and Computers.
The inventiveness of Europe’s leading economies is also reflected in the ratio of European patent applications to population. Switzerland (with 873 applications per million inhabitants), the Netherlands (419) and some of the Nordic countries topped the list again in 2015. Japan (169) was the first non-European country in the ranking with a ratio higher than the EU average (132), and also ahead of the US (133), South Korea (130) and China (4).
| Rank | Country | Applications per mio inhabitants | Population | Applications |
|---|---|---|---|---|
| 1. | Switzerland | 872.7 | 8 121 830 | 7 088 |
| 2. | Netherlands | 418.9 | 16 947 904 | 7 100 |
| 3. | Sweden | 391.7 | 9 801 616 | 3 839 |
| 4. | Finland | 365.2 | 5 476 922 | 2 000 |
| 5. | Denmark | 345.8 | 5 581 503 | 1 930 |
| 6. | Germany | 307.0 | 80 854 408 | 24 820 |
| 7. | Austria | 229.9 | 8 665 550 | 1 992 |
| 8. | Belgium | 180.2 | 11 323 973 | 2 041 |
| 9. | Japan | 168.8 | 126 919 659 | 21 426 |
| 10. | France | 162.0 | 66 553 766 | 10 781 |
| 11. | Israel | 136.7 | 8 049 314 | 1 100 |
| 12. | United States | 132.8 | 321 368 864 | 42 692 |
| 13. | Korea, Republic of | 130.5 | 49 115 196 | 6 411 |
| 14. | Ireland | 119.0 | 4 892 305 | 582 |
| 15. | Norway | 98.3 | 5 207 689 | 512 |
| 16. | United Kingdom | 78.6 | 64 088 222 | 5 037 |
| 17. | Singapore | 68.9 | 5 674 472 | 391 |
| 18. | Italy | 64.3 | 61 855 120 | 3 979 |
| 19. | Slovenia | 59.5 | 1 983 412 | 118 |
| 20. | Chinese Taipei | 53.8 | 23 415 126 | 1 260 |
| 21. | Canada | 46.9 | 35 099 836 | 1 645 |
| 22. | New Zealand | 42.4 | 4 438 393 | 188 |
| 23. | Australia | 36.0 | 22 751 014 | 819 |
| 24. | Spain | 31.7 | 48 146 134 | 1 527 |
| 25. | Cyprus | 31.1 | 1 189 197 | 37 |
| 26. | Estonia | 25.3 | 1 265 420 | 32 |
| 27. | Czech Republic | 20.0 | 10 644 842 | 213 |
| 28. | Poland | 14.7 | 38 562 189 | 568 |
| 29. | Latvia | 14.6 | 1 986 705 | 29 |
| 30. | Lithuania | 13.5 | 2 884 433 | 39 |
| 31. | Portugal | 12.7 | 10 825 309 | 137 |
| 32. | Qatar | 10.9 | 2 194 817 | 24 |
| 33. | Hong Kong | 10.4 | 7 141 106 | 74 |
| 34. | Hungary | 10.0 | 9 897 541 | 99 |
| 35. | Slovakia | 8.8 | 5 445 027 | 48 |
| 36. | Greece | 8.0 | 10 775 643 | 86 |
| 37. | Mauritius | 6.7 | 1 339 827 | 9 |
| 37. | Puerto Rico | 6.7 | 3 598 357 | 24 |
| 39. | Saudi Arabia | 6.6 | 27 752 316 | 182 |
| 40. | Turkey | 5.6 | 79 414 269 | 447 |
| 41. | United Arab Emirates | 4.7 | 5 779 760 | 27 |
| 41. | Bulgaria | 4.6 | 7 186 893 | 33 |
| 43. | China | 4.2 | 1 367 485 388 | 5 721 |
| 44. | Uruguay | 2.7 | 3 341 893 | 9 |
| 45. | Croatia | 2.0 | 4 464 844 | 9 |
| 46. | Malaysia | 1.8 | 30 513 848 | 56 |
| 46. | South Africa | 1.8 | 53 675 563 | 98 |
| 48. | Chile | 1.7 | 17 508 260 | 29 |
| 49. | Russian Federation | 1.6 | 142 423 773 | 230 |
| 50. | Romania | 1.5 | 21 666 350 | 33 |
|
We use cookies on our website to support technical features that enhance your user experience. We also use analytics. Access full information on cookies that we use and how to manage them |