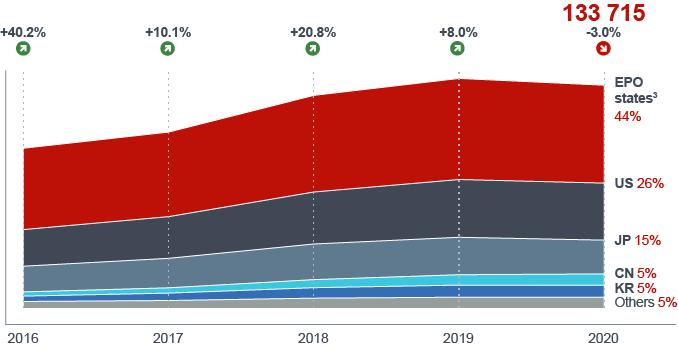
This graph shows the geographic origin of the patents granted by the EPO1 based on the country of residence of the first patentee listed on the published patent2.


This graph shows the geographic origin of the patents granted by the EPO1 based on the country of residence of the first patentee listed on the published patent2.

This analysis1 shows the number of designations for each of the EPO states.
| Country of residence of the patentee3 | Patents1 | Rate2 | |
|---|---|---|---|
| AL | Albania | 124 730 | 93.3% |
| AT | Austria | 132 650 | 99.2% |
| BE | Belgium | 132 664 | 99.2% |
| BG | Bulgaria | 132 503 | 99.1% |
| CH | Switzerland | 132 672 | 99.2% |
| CY | Cyprus | 132 624 | 99.2% |
| CZ | Czech Republic | 132 509 | 99.1% |
| DE | Germany | 133 535 | 99.9% |
| DK | Denmark | 132 644 | 99.2% |
| EE | Estonia | 132 502 | 99.1% |
| ES | Spain | 132 774 | 99.3% |
| FI | Finland | 132 662 | 99.2% |
| FR | France | 133 454 | 99.8% |
| GB | United Kingdom | 132 907 | 99.4% |
| GR | Greece | 132 631 | 99.2% |
| HR | Croatia | 129 768 | 97.1% |
| HU | Hungary | 132 451 | 99.1% |
| IE | Ireland | 132 616 | 99.2% |
| IS | Iceland | 131 984 | 98.7% |
| IT | Italy | 132 978 | 99.5% |
| LI | Liechtenstein | 132 672 | 99.2% |
| LT | Lithuania | 131 948 | 98.7% |
| LU | Luxembourg | 132 630 | 99.2% |
| LV | Latvia | 131 702 | 98.5% |
| MC | Monaco | 132 625 | 99.2% |
| MK | North Macedonia, Republic of | 128 171 | 95.9% |
| MT | Malta | 130 627 | 97.7% |
| NL | Netherlands | 132 773 | 99.3% |
| NO | Norway | 129 773 | 97.1% |
| PL | Poland | 132 222 | 98.9% |
| PT | Portugal | 132 634 | 99.2% |
| RO | Romania | 132 420 | 99.0% |
| RS | Serbia | 123 263 | 92.2% |
| SE | Sweden | 132 706 | 99.2% |
| SI | Slovenia | 132 454 | 99.1% |
| SK | Slovakia | 132 503 | 99.1% |
| SM | San Marino | 127 103 | 95.1% |
| TR | Turkey | 132 624 | 99.2% |
| Total | 5 004 108 | ||
