This graph shows the geographic origin of the European patent applications1 filed with the EPO. The geographic origin of the file is determined by the country of residence of the first applicant listed on the application form (first-named applicant principle2).


This graph shows the geographic origin of the European patent applications1 determined by the country of residence of the first applicant listed on the application form (first-named applicant principle2).

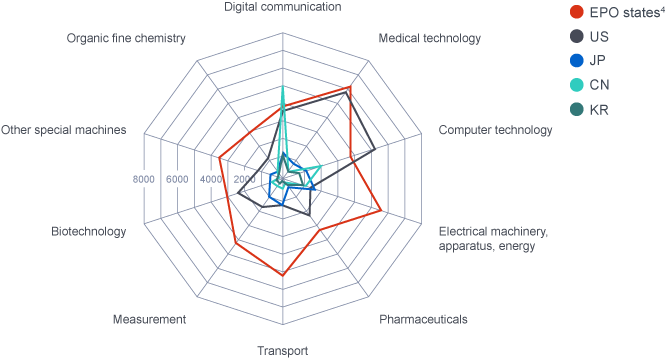
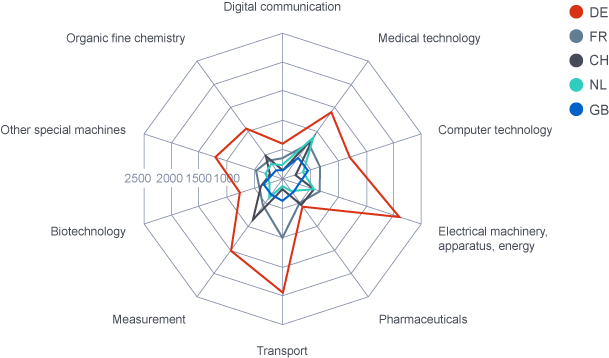
This page shows the number of European patent applications1 filed with the EPO for the ten technology fields2 with the largest number of applications in 2022. In 2022, these top ten fields represented almost 57% of the total number of European applications filed. Each technology field has its own page providing an analysis of the geographic origin of the files. The geographic origin is based on the country of residence of the first applicant listed on the application form (first-named applicant principle3). The pages also rank the largest applicants4 in each field.
This field encompasses lighting devices, power and electric energy supply systems, basic electric elements and techniques. Some specific examples of technologies in this field are power cables, magnets, relays and x-rays techniques.
| 2022 | ||
|---|---|---|
| 1. | LG | 1 109 |
| 2. | SIGNIFY | 398 |
| 3. | CONTEMPORARY AMPEREX | 387 |
| 4. | HUAWEI | 268 |
| 5. | PANASONIC | 248 |
| 6. | SIEMENS | 221 |
| 7. | VALEO | 194 |
| 8. | BOSCH | 191 |
| 9. | HITACHI | 186 |
| 10. | ABB | 183 |
| Others | 8 763 |
|
| Total applications in this field | 13 951 |
|

|
|
2022 vs. 2021 | |
|---|---|---|
| Germany | 2 015 |
-3.5% |
| France | 777 | +17.2% |
| Netherlands | 608 | +6.9% |
| Switzerland | 525 | -2.6% |
| Austria | 341 | +4.3% |
| Other EPO states5 | 1 424 |
+2.6% |
| United States | 1 874 |
+18.1% |
| Japan | 2 100 |
+19.9% |
| China, People's Republic of | 1 966 |
+47.4% |
| Korea, Republic of | 1 751 |
+67.7% |
| Others | 570 | +11.8% |
| Total applications in this field | 13 951 |
|
The field of Medical technology covers medical instruments for diagnosis, treatment of diseases and surgery. Technologies included in this field are, for example, vaccination instruments, prostheses, surgical robots, computed tomography and pacemakers.
| 2022 | ||
|---|---|---|
| 1. | JOHNSON & JOHNSON | 773 |
| 2. | ROYAL PHILIPS |
683 |
| 3. | MEDTRONIC |
550 |
| 4. | BECTON DICKINSON | 285 |
| 5. | BOSTON SCIENTIFIC |
278 |
| 6. | EDWARDS LIFESCIENCES | 199 |
| 7. | BIOTRONIK |
193 |
| 8. | FRENESIUS | 144 |
| 9. | RESMED | 139 |
| 10. | SIEMENS | 125 |
| Others | 11 020 |
|
| Total applications in this field | 15 683 |
|

|
|
2022 vs. 2021 | |
|---|---|---|
| Germany | 1 391 |
-1.6% |
| Switzerland | 1 159 |
+34.6% |
| Netherlands | 885 | +0.6% |
| France |
733 | -1.1% |
| United Kingdom | 493 | +4.9% |
| Other EPO states5 | 1 881 |
-1.3% |
| United States | 5 866 |
-1.1% |
| Japan | 937 | -12.8% |
| China, People's Republic of | 601 | +31.5% |
| Korea, Republic of | 412 | +9.0% |
| Others | 1 325 |
-6.3% |
| Total applications in this field | 15 683 |
|
This field encompasses basic electronic circuitry and electronic communication. The field includes, for example, amplifiers, decoders and telegraphic communication.
| 2022 | ||
|---|---|---|
| 1. | QUALCOMM | 2 155 |
| 2. | HUAWEI | 2 082 |
| 3. | ERICSSON | 1 298 |
| 4. | SAMSUNG | 727 |
| 5. |
ZTE |
661 |
| 6. |
NOKIA |
620 |
| 7. | OPPO6 |
549 |
| 8. | LG | 433 |
| 9. | NTT DOCOMO | 421 |
| 10. | APPLE | 363 |
| Others | 4 720 |
|
| Total applications in this field | 16 705 |
|

|
|
2022 vs. 2021 | |
|---|---|---|
| Sweden | 1 360 |
-5.4% |
| Finland | 650 | -1.4% |
| Germany | 602 | -17.3% |
| France | 340 | -9.8% |
| Netherlands | 258 | -2.3% |
| Other EPO states5 | 584 | +4.7% |
| United States | 5 020 |
+35.5% |
| Japan | 1 222 |
-9.5% |
| China, People's Republic of | 4 705 |
+10.9% |
| Korea, Republic of | 1 316 | +22.6% |
| Others | 648 | +2.0% |
| Total applications in this field | 16 705 |
|
This field encompasses computing, calculating and counting devices. It includes, for example, digital computers and data processing systems.
| 2022 | ||
|---|---|---|
| 1. | HUAWEI | 727 |
| 2. | MICROSOFT | 658 |
| 3. | SAMSUNG | 639 |
| 4. | ALPHABET | 569 |
| 5. | INTEL | 405 |
| 6. | SIEMENS | 389 |
| 7. | BAIDU | 330 |
| 8. | TENCENT | 236 |
| 9. | MICRON TECHNOLOGY |
232 |
| 10. | SONY | 218 |
| Others | 8 977 |
|
| Total applications in this field | 15 193 |
|

|
|
2022 vs. 2021 | |
|---|---|---|
| Germany | 1 237 |
+3.3% |
| France | 711 | +0.9% |
| United Kingdom | 506 | +10.2% |
| Sweden | 360 | +64.4% |
| Netherlands | 356 | +8.5% |
| Other EPO states5 | 1 229 |
+18.5% |
| United States | 5 469 |
+2.2% |
| Japan | 1 221 |
-12.0% |
| China, People's Republic of | 2 343 |
+2.7% |
| Korea, Republic of | 904 | -12.2% |
| Others | 857 | -8.7% |
| Total applications in this field | 15 193 |
|
This field encompasses vehicles, and more specifically vehicle tyres, wheels, windows and roofs, railway systems.
| 2022 | ||
|---|---|---|
| 1. | AIRBUS | 325 |
| 2. | VOLVO GROUP |
286 |
| 3. | RAYTHEON TECHNOLOGIES | 247 |
| 4. | SIEMENS |
179 |
| 5. | SUMITOMO RUBBER INDUSTRIES |
161 |
| 6. | TOYOTA MOTOR |
157 |
| 7. | VALEO |
150 |
| 8. | CONTINENTAL |
133 |
| 9. | STELLANTIS | 124 |
| 10. | VOLKSWAGEN / BRIDGESTONE |
123 |
| Others | 6 586 |
|
| Total applications in this field | 9 272 |
|

|
|
2022 vs. 2021 | |
|---|---|---|
| Germany | 1 877 |
-6.3% |
| France | 1 005 |
-1.6% |
| Sweden | 575 | +21.6% |
| United Kingdom |
380 | +16.9% |
| Italy | 362 | -8.8% |
| Other EPO states5 | 1 082 |
-1.5% |
| United States | 1 375 |
-11.9% |
| Japan | 1 341 |
-7.6% |
| China, People's Republic of | 614 | +17.2% |
| Korea, Republic of | 260 | +6.1% |
| Others | 401 | -5.0% |
| Total applications in this field | 9 272 |
|
This field encompasses horology, devices for measuring position and displacement, more specifically clocks and watches, navigation systems, volume, liquid and sound measuring devices.
| 2022 | ||
|---|---|---|
| 1. | SIEMENS | 174 |
| 2. | SWATCH GROUP | 157 |
| 3. | RAYTHEON TECHNOLOGIES | 136 |
| 4. | HUAWEI | 130 |
| 5. | LG | 128 |
| 6. | HITACHI | 122 |
| 7. | ROYAL PHILIPS | 100 |
| 8. | SONY |
96 |
| 9. | CEA6 | 85 |
| 9. | APTIV | 85 |
| Others | 7 416 |
|
| Total applications in this field | 9 185 |
|

|
|
2022 vs. 2021 | |
|---|---|---|
| Germany | 1 501 |
-4.6% |
| Switzerland | 733 | -1.2% |
| France | 587 | +5.0% |
| Netherlands | 335 | -2.9% |
| United Kingdom | 298 | +20.2% |
| Other EPO states5 | 1 031 | -2.5% |
| United States | 1 980 |
-1.1% |
| Japan | 1 164 |
-5.1% |
| China, People's Republic of | 623 | +26.6% |
| Korea, Republic of | 314 | +20.3% |
| Others | 619 | +5.3% |
| Total applications in this field | 9 185 |
|
This field encompasses organic pure substances, combinatorial chemistry, and preparations for medical, dental and hygiene uses. It includes, for example, steroids, sugars, cosmetics, pharmaceuticals and food ingredients.
| 2022 | ||
|---|---|---|
| 1. | BASF | 204 |
| 2. | UNILEVER | 188 |
| 3. | BAYER | 122 |
| 4. | HOFFMANN-LA ROCHE |
119 |
| 5. | CHINA NATIONAL CHEMICAL | 100 |
| 6. | L'OREAL | 90 |
| 7. | PROCTER & GAMBLE | 84 |
| 8. | HENKEL |
83 |
| 9. | MERCK |
78 |
| 10. | EVONIK INDUSTRIES |
76 |
| Others | 4 488 |
|
| Total applications in this field | 5 955 |
|

|
|
2022 vs. 2021 | |
|---|---|---|
| Germany | 956 |
-8.6% |
| Switzerland | 481 | -1.6% |
| Netherlands | 406 | +19.4% |
| France | 403 | -2.9% |
| United Kingdom | 176 | -12.9% |
| Other EPO states5 | 567 |
-2.4% |
| United States | 1 294 |
-13.3% |
| Japan | 507 | +5.6% |
| China, People's Republic of | 540 | +39.9% |
| Korea, Republic of | 311 | +14.8% |
| Others | 314 | +14.2% |
| Total applications in this field | 5 955 |
|
This field encompasses combustion engines, engines and pumps for liquids, eolic energy, nuclear physics and engineering. It covers, for example, gas-turbine plants, pumps and pistons, fusion and nuclear reactors, x-ray microscopes and wind motors.
| 2016 | ||
|---|---|---|
| 1. | UNITED TECHNOLOGIES | 956 |
| 2. | GENERAL ELECTRIC | 700 |
| 3. | SIEMENS | 357 |
| 4. | ROLLS-ROYCE | 207 |
| 5. | TOYOTA MOTOR | 162 |
| 6. | SAFRAN | 160 |
| 7. | ROBERT BOSCH | 144 |
| 8. | MITSUBISHI HEAVY INDUSTRIES | 130 |
| 9. | CONTINENTAL | 86 |
| 10. | MAHLE | 63 |
| Others | 3 336 | |
| Total applications in this field | 6 301 | |

|
|
2017 vs. 2016 | |
|---|---|---|
| Germany | 1 278 | -11.4% |
| France | 391 | +21.1% |
| Switzerland | 146 | -36.8% |
| Netherlands | 42 | -30.0% |
| United Kingdom | 229 | -16.7% |
| other EPO member states | 746 | +9.2% |
| United States | 2 229 | +8.0% |
| Japan | 890 | -4.2% |
| China, People’s Republic of | 84 | +104.9% |
| Korea, Republic of | 80 | -9.1% |
| Others | 186 | -6.1% |
| Total applications in this field | 6 301 | |
This field encompasses preparations for medical, dental or hygiene purposes, for example emulsions, dragees and amalgams.
| 2022 | ||
|---|---|---|
| 1. | JOHNSON & JOHNSON | 129 |
| 2. | INSERM6 | 102 |
| 3. | UNIVERSITY OF CALIFORNIA |
97 |
| 4. | MERCK & CO | 68 |
| 5. | HOFFMANN-LA ROCHE | 67 |
| 6. | NESTLE | 63 |
| 6. | NOVARTIS | 63 |
| 8. | DSM | 61 |
| 9. | SANOFI | 57 |
| 10. | GLAXO SMITH KLINE | 49 |
| Others | 8 036 |
|
| Total applications in this field | 9 310 |
|

|
|
2022 vs. 2021 | |
|---|---|---|
| Germany | 613 | -4.5% |
| Switzerland | 520 | +2.2% |
| France | 507 | +3.3% |
| United Kingdom |
322 | -2.1% |
| Netherlands | 265 | +6.9% |
| Other EPO states5 | 1 425 |
+5.9% |
| United States | 3 692 |
+5.5% |
| Japan | 570 | -0.5% |
| China, People’s Republic of | 409 | -18.0% |
| Korea, Republic of | 264 | -16.2% |
| Others | 723 | -5.5% |
| Total applications in this field | 9 310 |
|
This field encompasses peptides, microbiology and genetic engineering. Included in the field are, for example, genetically modified organisms, brewing of beers, preparation of wine and vinegar.
| 2022 | ||
|---|---|---|
| 1. | HOFFMANN-LA ROCHE | 155 |
| 2. | INSERM6 | 76 |
| 3. | UNIVERSITY OF CALIFORNIA | 71 |
| 4. | NOVOZYMES | 64 |
| 4. | CJ CHEILJEDANG | 64 |
| 6. | BASF | 63 |
| 7. | SANOFI | 60 |
| 8. | JOHNSON & JOHNSON | 53 |
| 9. | REGENERON PHARMACEUTICALS | 51 |
| 10. | AMGEN | 45 |
| Others | 7 170 | |
| Total applications in this field | 8 168 |
|

|
|
2022 vs. 2021 | |
|---|---|---|
| Germany | 770 | +1.6% |
| France | 462 | -4.7% |
| Switzerland | 454 | +17.6% |
| United Kingdom | 345 | +1.8% |
| Denmark | 283 | +17.4% |
| Other EPO states5 | 1 088 |
+10.9% |
| United States | 2 756 |
+6.1% |
| Japan | 538 |
+7.0% |
| China, People’s Republic of | 622 | +44.3% |
| Korea, Republic of | 364 | +54.9% |
| Others | 486 | +20.0% |
| Total applications in this field | 8 168 |
|
The field of “other special machines” covers machine tools for agriculture, textile, paper, food (i.e. sugar industry production), shaping of plastic, cement and clay, as well as manufacturing of 3D objects.
| 2022 | ||
|---|---|---|
| 1. | CNH INDUSTRIAL | 186 |
| 2. | DEERE | 95 |
| 3. | BASF | 91 |
| 4. | GENERAL ELECTRIC | 72 |
| 5. | SIGNIFY | 71 |
| 6. | TETRA LAVAL | 68 |
| 7. | LG |
62 |
| 7. | CLAAS KGAA |
62 |
| 9. | AGCO | 57 |
| 10. | RAYTHEON TECHNOLOGIES | 53 |
| Others | 5 285 |
|
| Total applications in this field | 6 382 |
|

|
|
2022 vs. 2021 | |
|---|---|---|
| Germany | 1 251 |
+1.9% |
| France | 494 | +0.4% |
| Italy | 355 | +9.6% |
| Netherlands | 326 | +6.9% |
| Belgium | 259 | +52.4% |
| Other EPO states5 | 1 214 |
-1.6% |
| United States | 1 222 |
-16.2% |
| Japan | 664 | -4.3% |
| China, People’s Republic of | 124 | -16.2% |
| Korea, Republic of | 150 | +33.9% |
| Others | 323 | -4.2% |
| Total applications in this field | 6 382 |
|
This analysis shows the number of European patent applications1 filed with the EPO in the different technology fields2.
| Technical Field | 2022 | 2021 | Change |
|
|
|---|---|---|---|---|---|
| Electrical engineering | Electrical machinery, apparatus, energy | 13 951 |
11 801 |
18.2% | |
| Audio-visual technology | 5 700 |
5 274 |
8.1% | ||
| Telecommunications | 4 244 |
4 342 |
-2.3% | ||
| Digital communication | 16 705 |
15 029 |
11.2% | ||
| Basic communication processes | 1 131 |
1 015 |
11.4% | ||
| Computer technology | 15 193 |
14 931 |
1.8% | ||
| IT methods for management | 2 374 |
2 449 |
-3.1% | ||
| Semiconductors | 4 366 |
3 640 |
19.9% | ||
| Instruments | Optics | 4 185 |
4 157 |
0.7% | |
| Measurement | 9 185 |
9 095 |
1.0% | ||
| Analysis of biological materials | 1 322 |
1 225 |
7.9% | ||
| Control | 3 469 |
3 387 |
2.4% | ||
| Medical technology | 15 683 |
15 524 |
1.0% | ||
| Chemistry | Organic fine chemistry | 5 955 |
5 978 |
-0.4% | |
| Biotechnology | 8 168 |
7 361 |
11.0% | ||
| Pharmaceuticals | 9 310 |
9 216 |
1.0% | ||
| Macromolecular chemistry, polymers | 4 150 |
4 261 |
-2.6% | ||
| Food chemistry | 1 985 |
2 146 |
-7.5% | ||
| Basic materials chemistry | 4 269 |
4 540 |
-6.0% | ||
| Materials, metallurgy | 3 911 |
4 049 |
-3.4% | ||
| Surface technology, coating | 2 775 |
2 675 |
3.7% | ||
| Micro-structural and nano-technology | 141 | 126 | 11.9% | ||
| Chemical engineering | 4 067 |
4 246 |
-4.2% | ||
| Environmental technology | 1 850 |
1 878 |
-1.5% | ||
| Mechanical engineering | Handling | 4 750 |
4 557 |
4.2% | |
| Machine tools | 3 487 |
3 532 |
-1.3% | ||
| Engines, pumps, turbines | 4 025 |
4 344 |
-7.3% | ||
| Textile and paper machines | 2 220 |
2 267 |
-2.1% | ||
| Other special machines | 6 382 |
6 502 |
-1.8% | ||
| Thermal processes and apparatus | 2 736 |
2 628 |
4.1% | ||
| Mechanical elements | 3 665 |
3 821 |
-4.1% | ||
| Transport | 9 272 |
9 520 |
-2.6% | ||
| Other fields | Furniture, games | 3 160 |
3 345 |
-5.5% | |
| Other consumer goods | 4 811 |
5 159 |
-6.7% | ||
| Civil engineering | 4 355 |
4 518 | -3.6% | ||
| Not classified | 508 |
271 |
87.5% | ||
| Total | 193 460 |
188 809 | |||
This analysis reflects the number of European patent applications filed1 with the EPO in each of the top ten technology fields3 for each of the main countries of origin2.
This analysis shows country ranking2 based on the ratio of number of European patent applications filed with the EPO1 per million inhabitants3. The ratio per million inhabitants is for countries with a population of at least 1 million inhabitants.
| Rank | Country | Applications per mio inhabitants | Population3 (mio inhabitants) |
Applications1 |
|---|---|---|---|---|
| 1. | Switzerland | 1.031.1 | 8.737 | 9 008 |
| 2. | Sweden | 481.8 | 10.452 | 5 036 |
| 3. | Denmark | 453.2 | 5.873 | 2 662 |
| 4. | Netherlands | 386.9 | 17.591 | 6 806 |
| 5. | Finland | 385.7 | 5.548 | 2 140 |
| 6. | Germany | 296.6 | 83.237 | 24 684 |
| 7. | Austria | 266.0 | 8.979 | 2 388 |
| 8. | Ireland | 225.3 | 5.060 | 1 140 |
| 9. | Belgium | 223.9 | 11.631 | 2 604 |
| 10. | Korea, Republic of | 200.1 | 51.816 | 10 367 |
| 11. | Israel |
192.6 | 9.038 | 1 741 |
| 12. | Japan | 174.1 | 123.952 | 21 576 |
| 13. | France | 160.7 | 67.843 | 10 900 |
| 14. | United States | 142.2 | 338.290 | 48 088 |
| 15. | Singapore | 139.7 | 5.976 | 835 |
| All EPO members | 133.6 | 628.212 | 83 955 | |
| 16. | Norway | 121.7 | 5.425 | 660 |
| 17. | United Kingdom |
84.4 | 67.509 | 5 697 |
| 18. | Italy |
82.5 | 58.983 | 4 864 |
| 19. | Chinese Taipei |
61.7 | 23.893 | 1 474 |
| 20. | Slovenia | 58.4 | 2.107 | 123 |
| 21. | Canada | 52.0 | 38.454 | 2 001 |
| 22. | Estonia | 49.6 | 1.332 | 66 |
| 23. | New Zealand |
44.4 | 5.185 | 230 |
| 24. | Hong Kong SAR (China) |
44.2 | 7.489 | 331 |
| 25. | Spain | 40.6 | 47.433 | 1 925 |
| 26. | Australia | 38.3 | 26.177 | 1 003 |
| 27. | Cyprus | 33.6 | 1.251 | 42 |
| 28. | Portugal | 30.1 | 10.352 | 312 |
| 29. | Lithuania |
27.8 | 2.806 | 78 |
| 30. | Czech Republic | 20.8 | 10.517 | 219 |
| 31. | Greece |
17.4 | 10.604 | 185 |
| 32. | Poland | 16.3 | 37.654 | 615 |
| 33. | Mauritius |
14.6 | 1.299 | 19 |
| 34. | China, People's Republic of |
13.4 | 1.425.887 | 19 041 |
| 35. | Puerto Rico |
13.2 | 3.252 | 43 |
| 36. | Latvia |
11.7 | 1.876 | 22 |
| 37. | Hungary |
10.5 | 9.689 | 102 |
| 38. | Slovakia |
9.0 | 5.435 | 49 |
| 39. | Croatia |
8.2 | 3.879 | 32 |
| 40. | United Arab Emirates |
7.3 | 9.441 | 69 |
| 41. | Bulgaria | 6.6 | 6.839 | 45 |
| 42. | Türkiye |
6.4 | 85.341 | 542 |
| 43. | Saudi Arabia |
5.7 | 36.409 | 206 |
| 44. | Uruguay | 4.1 | 3.423 | 14 |
| 45. | Qatar | 3.0 | 2.695 | 8 |
| 46. | Chile | 2.4 | 19.604 | 48 |
| 47. | Romania |
2.4 | 19.038 | 46 |
| 48. | Panama | 2.3 | 4.409 | 10 |
| 49. | Bosnia and Herzegovina |
2.2 | 3.234 | 7 |
| 50. | Costa Rica |
1.7 | 5.181 | 9 |


